Japanese Circulation Society
Site mapContact Us
Welcome to JCS web Site
Congres Report
 

Symposium 15

 
New Trends in Echocardiography
 
New Trends in Echocardiography
James D. Thomas
Cleveland Clinic
Cleveland, Ohio
Diagnosis of Coronary Artery Disease by Detection of Postischemic Left Ventricular Diastolic Dyssynchrony after Treadmill Exercise Using 2-D Speckle Tracking
Katsuhisa Ishii
Kansai Denryoku Hospital
Osaka, Japan
Assessment of Regional Left Ventricular Myocardial Function in Patients with Ischemic Heart Disease Using Tissue Doppler and 2-D Speckle-Tracking Imaging
Takashi Tanimoto
Wakayama Medical University
Wakayama, Japan
 
New Trends in Echocardiography
James D. Thomas
Cleveland Clinic
Cleveland, Ohio
 

Rapid advances in echocardiography in recent years has poised us at the threshold of several paradigm shifts within this field, according to James D. Thomas of Cleveland Clinic, who focused on 3-D Echo and straining and speckle tracking in this lecture.


3-D Echocardiography

 Real-time 3-D Echo has evolved rapidly, and small matrix arrays and transesophogeal echocardiography (TEE) can be used for guiding interventions where the overall geometry can be reconstructed. For example, imaging of a mitral valve provides clear visualization of flail of the middle scallop of the posterior leaflet and flail of the medial scallop (P3) from the left atrium before surgery and after repair clear easy visualization of the ring and improved function.

Current uses for real-time 3-D Echo include:

  • Intraoperative Echo
    • Atrial valve repair, mitral valve repair, tricuspid repair
    • Congenital Repairs
  • Percutaneous coronary interventions (PCI)
    • Mitral valve repair (balloon annuloplasty, annuloplasty ring, leaflet clip)
    • Aortic valve repair (balloon valvuloplasty, transfemoral or transapical AVR)
  • Closure Devices
    • Patent foramen ovale (PFO), ASD, VSD, paravalvular leaks

Thomas reviewed cases such as percutaneous mitral valvuloplasty for rheumatic mitral stenosis where TEE is particularly useful and PFO device placement where TEE is especially useful for trans-septal passage and clear visualization of device deployment.


Live 3-D TEE for percutaneous valve replacement

Thomas stated this is one of the most exciting developing areas and one in which he and his colleagues are actively involved. The percutaneous valves are essentially stents that provide good hemodynamics after placement. Live 3-D guided percutaneous aortic valve replacement(PAVR) during rapid pacing provides excellent visualization throughout. In another case, Thomas showed the utility of live 3-D guided valve placement in a 78 year-old woman who was not a surgical candidate because of multiple severe comorbidities. During placement there was excellent visualization of large posterior valvular leaks and anterior paravalvular leaks and appropriate placement.

Thomas predicts that further progress in improvement in TEE will lead to it becoming the standard for imaging and guiding percutaneous procedures and that 2-D images will be extracted from the 3-D data sets.


Analysis of LV mechanics by speckle tracking

Speckle tracking allows for deriving strain and torsion from B-mode imaging by tracking small interference patterns and their deformation over time. Although this is a 20-year old concept, it can now be implemented because of improvements in technology. Speckle tracking is robust and reproducible. Integrating three apical views provides for creating a Bull’s eye plot that easily shows systolic function.

In a study of 242 normal subjects (41% men, average age 48 years, no cardiac history, no risk factors, no drug treatment) Marwick, Thomas and colleagues showed that average strain (-20) was similar to that determined by tissue Doppler imaging (TDI). There was good reproducibility of parameters, such as systolic strain rate (1.01) and E wave strain rate (1.26). A slight reduction in strain rate with age was seen, similar to that seen with TDI.

A study to recognize acute myocardial infarction (AMI) with speckle tracking by Thomas and German colleagues showed in 103 participants (62 first MI, 41 normal subjects) there was 93% sensitivity and specificity. Further, there was good location of the infarct and excellent interobserver reproducibility. He noted that the Echoes were obtained after the AMI. Good correlation between global strain and CPK leak and an inverse relation between global strain and angiographic ejection fraction were found.

Speckle tracking echocardiography can be used in serial examination, exercise and dobutamine ST Echo is a developing area, and it has been used to determine LV torsion with good concordance with MRI.

A feasibility study showed there was reliable semi-automated quantification of regional myocardial strain by ST Echo and it is feasible in a routine clinical setting with minimal incremental expenditure. The study of 106 unselected patients (mean age 63 years) compared longitudinal strain to wall motion scoring, and showed that 99% of segments were visualized and 96% of segments were tracked; 74% were tracked on initial placement of the ROI and accurately. The time from image acquisition to Bull’s eye plot display was about 3 minutes. There was good serial data, good correlation between wall scoring and strain, strong discriminating power for identifying wall motion abnormalities, and good interobserver reproducibility.

 
Page Top
 
Diagnosis of Coronary Artery Disease by Detection of Postischemic Left Ventricular Diastolic Dyssynchrony after Treadmill Exercise Using 2-D Speckle Tracking
Katsuhisa Ishii
Kansai Denryoku Hospital
Osaka, Japan
 

Echocardiographic evaluation of regional myocardial wall motion by strain imaging (SI) could be a noninvasive method for detection of prolonged post-ischemic diastolic dyssynchrony or myocardial stunning and the identification of angina-provoking vessels, based on the results of a study by Ishii and colleagues presented in this lecture.

Previous work by this group demonstrated that impaired or stunned regional diastolic function with delayed outward wall motion persisted beyond recovery after ischemia in patients with effort angina during the treadmill exercise stress test.

In the present study, this group used 2-D specking tracking (2-D ST) in 162 patients (65 women, average age 63 years) with stable effort angina to determine the ability of this technology to identify post-ischemic left ventricular (LV) diastolic dyssonchrony after treadmill stress testing and to accurately diagnose coronary artery disease (CAD).

The control group comprised 30 subjects (18 men and 12 women with a mean age of 57 years) without chest pain or any cardiovascular disease who had negative findings on treadmill exercise tests.

Symptom-limited treadmill exercise testing (TET) using Bruce protocol was performed 1week before diagnostic coronary angiography. Views obtained with 2-D ST include apical axis, 2-chamber and 4-chamber, using a 2.5 mHz transducer at baseline and 5 minutes after TET.

Figure 1. Transverse strain curve and SI-DI in a control subject. Strain values at the aortic valve closure (A) and at one-third of the diastole duration (B) were measured.
【Click to enlarge】

The end systolic values of strain at the closure of the aortic valve (A) and at one-third of the diastole duration (B) were measured. The SI-diastolic index (SI-DI) was determined as (A-B)/A × 100%  to assess the regional LV active relaxation (Figure 1). The ratio of SI-DI before and after exercise was defined as the SI-DI ratio and was used to identify regional LV delayed relaxation. The mean SI-DI at baseline in the 30 control subjects was 84%, 86%, and 85%  in the anteroseptal, anterolateral, and inferior segments, respectively.

In the 114 patients diagnosed with CAD, the coronary angiographic findings were:

  • vessel disease: 57 patients.
  • vessel disease: 29 patients.
  • vessel disease: 20 patients.
  • LMT: 8 patients.

The changes in the SI-DI ratios in the territories perfused by coronary arteries with significant and nonsignificant stenoses after treadmill exercise test are shown in Figures 2 and 3, respectively.

Figure 2. Comparison of strain imaging diastolic indices (SI-DI) at baseline and 5 minutes after treadmill exercise in segments perfused by coronary arteries with significant (≥50% of luminal diameter) stenosis. Changes in SI-DI were measured at the mid-anteroseptal (A-S), mid-anterolateral (LAT), and mid-inferior (INF) segments. SI-DI significantly decreased 5 minutes after exercise compared to baseline.
【Click to enlarge】
Figure 3. Comparison of strain imaging diastolic indices (SI-DI) at baseline and 5 minutes after exercise in segments perfused by coronary arteries with nonsignificant (<50% of luminal diameter) stenosis. Changes in SI-DI were measured at mid-anteroseptal (A-S), mid-anterolateral (LAT), and mid-inferior (INF) segments. SI-DI remained essentially unchanged after exercise compared to baseline.
【Click to enlarge】


Key findings in the present study include:

  • In 91 (80%) of CAD patients, stress-induced regional wall motion was found immediately after treadmill exercise stress test.
  • In 10 (9%) of CAD patients, systolic wall motion abnormalities was found 5 minutes after treadmill exercise stress testing.
  • In 171 of 191 (90%) of territories perfused by stenotic coronary arteries, regional wall dysfunction was found.
  • A 90% specificity and sensitivity for the SI-DI ratio 5 minutes after treadmill exercise testing.  

Figure 4. 2-D speckle tracking images in apical long axis view (top), and transverse strain curves in mid-anteroseptal (orange curve) and mid-inferolateral (purple curve) segments (bottom), obtained from a 68-year-old male patient with 70% coronary stenosis in segment 7 of the left anterior descending (LAD) at baseline, immediately after, and 5 minutes after the treadmill exercise. See text for details.
【Click to enlarge】

Ishii reviewed the case of a 68-year-old male patient with 70% coronary stenosis in segment 7 of the left anterior descending (LAD) at baseline (Figure 4). Immediately after exercise, a significant decrease of the peak systolic strain developed in the mid-anteroseptal segment (top, white arrow). Five minutes after exercise, high level of strain (top, yellow arrow) appeared in the mid-anteroseptal segment at one-third of the diastole duration due to postischemic delayed relaxation. At baseline, the SI-DI was 76% in the mid-anteroseptal segment. At 5 minutes after exercise, the index decreased to 4% and improved but remained depressed (23%) in the anteroseptal segment. No apparent changes in the SI-DI were observed during the follow-up period in the mid-posterior segment.

 
Page Top
 
Assessment of Regional Left Ventricular Myocardial Function in Patients with Ischemic Heart Disease Using Tissue Doppler and 2-D Speckle-Tracking Imaging
Takashi Tanimoto
Wakayama Medical University
Wakayama, Japan
 

Two-dimensional speckle tracking (2-D ST) and tissue Doppler imaging (TDI), recent advances in echocardiography that allow non-invasive assessment of regional myocardial motion, were used in two studies by Tanimoto and colleagues at Wakayama Medical University presented in this lecture. The results of these studies showed these new modalities are useful non-invasive methods to assess myocardial ischemia and the transmural extent of myocardial necrosis in patients with angina pectoris and myocardial infarction.


Assessment of baseline parameters

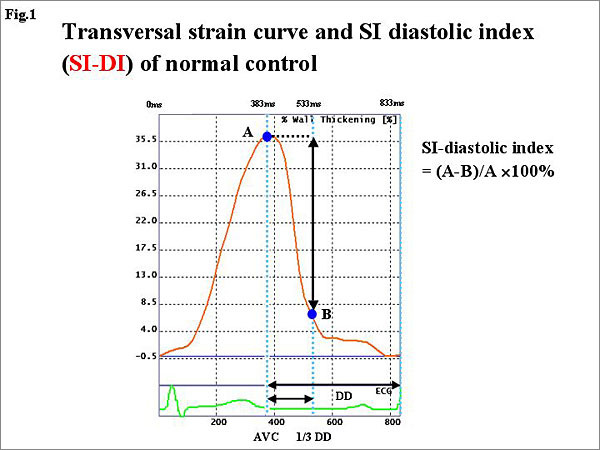
Figure 1. A representative normal subject who had tissue strain imaging. In the color-coded strain image obtained by TDI-Q (left panel) the bright color indicates the myocardial thickening. The brighter endocardial layer compared to the epicardial layer indicates the heterogeneous wall thickening. The brighter endocardial layer compared to the epicardial layer indicates the heterogeneous wall thickening.
【Click to enlarge】
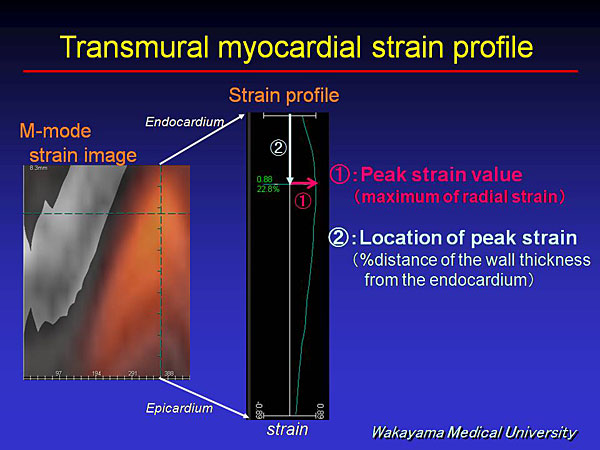
Figure 2. Transmural myocardial strain profile in a normal subject at end systole shows the strain is highest at the subendocardial side and liner regression to the epicardium is seen (middle panel). Peak strain was calculated as the percent of the distance of the wall thickness from the endocardium (right panel).
【Click to enlarge】

 Regional systolic function was evaluated in 15 patients with angina pectoris and 30 patients with ST segment elevation acute myocardial infarction (AMI) before the studies in these two groups. The commercially available ultrasound machines and analytical software used automatically divided the left ventricle (LV) into six segments, allowing assessment of radius, circumferential strain, and rotation in each segment.

Figure 1 illustrates the images obtained with the tissue strain imaging technique.

In this representative normal subject, the color-coded strain image obtained by TDI-Q is shown in the left panel, with myocardial thickening indicated by the bright color. M-mode strain images are obtained by placing the M-mode cursor at left ventricle. Heterogeneity of wall thickening is indicated by the brighter endocardial layer compared to the epicardial layer.

Figure 2 illustrates the transmural myocardial strain profile at end systole (middle panel). The strain is highest at the subendocardial side and shows a liner regression to the epicardium in a normal subject. Peak strain value, which indicates the highest radial strain of the ventricular wall, was measured, and the location of the peak strain value was calculated as the percent of the distance of the wall thickness from the endocardium.


Study of angina pectoris

Tanimoto and colleagues adapted these techniques to study the 15 patients with angina pectoris undergoing percutaneous coronary intervention (PCI). LV wall motion was recorded during PCI and Echo during and after balloon occlusion. The asynergy of the antero-septal wall was easily detected during the 15-second balloon occlusion, and improvement of asynergy was seen after balloon deflation.

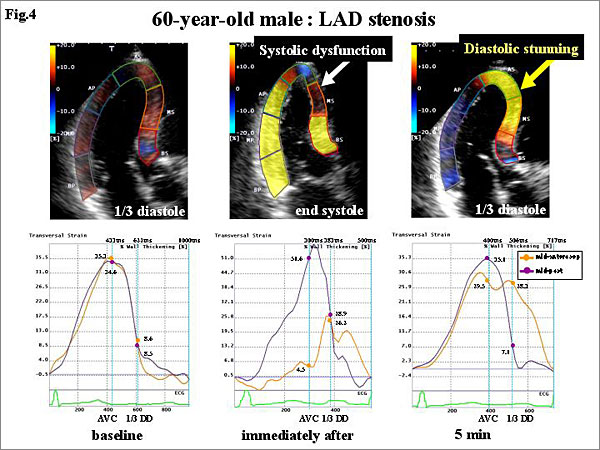
In a representative case of angina analyzed by TDI, during ischemia the location of peak strain shifted from the subendocardial to the epicardial side, and this shift improved after balloon deflation. At baseline the peak strain value was 0.67 compared to 0.48 during ischemia and 0.74 during recovery. The location of peak strain was 11.3 at baseline and 47.4 during ischemia, and 15.4 during recovery.

In these patients, TDI assessment after 15-second balloon occlusion showed the peak strain value significantly decreased to 0.43 (from 1.12 at baseline) and significantly improved at the recovery phase to 0.96. During balloon occlusion, the location of peak strain significantly shifted from the endocardial to epicardial side, and returned to the endocardial side during the recovery phase. The 2-D ST during and after balloon occlusion revealed that the rotation decreased and that it improved more rapidly than did the radial or the circumferential strain.


Study of AMI

In the 30 patients with AMI, echocardiography was performed twice within the first 24-hours and 2 weeks after AMI onset to record LV wall motion. Cardiac MRI to assess the extent of myocardial necrosis was performed. Patients with an unsuccessful PCI, atrial fibrillation, renal dysfunction, or contraindications to MRI were excluded.

Figure 3. MRI and strain images of patients with inferior MI revealed that the location of peak strain shifted from the endocardial to epicardial side as the necrosis extends more deeply
【Click to enlarge】

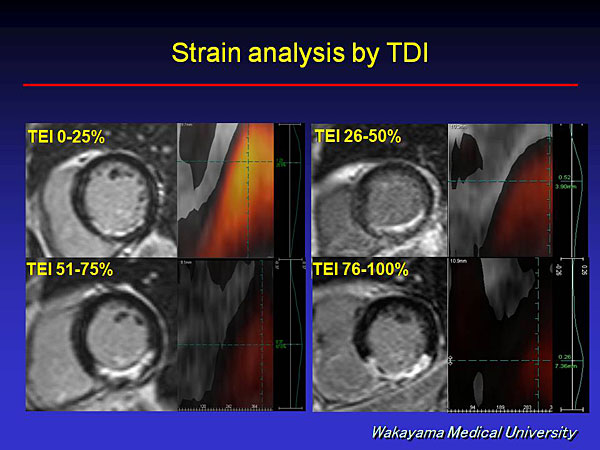
Transmural extent of infarction (TEI) was obtained by MRI two weeks after MI onset, and patients were divided into 4 groups. MRI and strain images of patients with inferior MI revealed that the location of peak strain shifted from the endocardial to epicardial side as the necrosis extended more deeply (Figure 3). Further, as the TEI increased, peak strain value decreased and the location of the peak strain shifted from the endocardial to epicardial side.

Combining a cut-off value of 43 for peak strain value and 58 for location of peak strain provided a sensitivity of 100% and specificity of 97% for predicting non-viable myocardial muscle.

Regarding 2-D ST, they found that the recovery of rotation is lower as the TEI increased, and similar results were found for radial and circumferential strain, when comparing the acute and subacute phases.

 
Page Top