The research presented by Goldberger conducted in his
laboratory had two goals. One, to evaluate a new technique
for frequency analysis in the evaluation of atrial fibrillation
(AF) electrograms. Since many episodes of AF are thought
to have focal trigger mechanisms for initiation and maintenance.
Thus, they endeavored to develop a technique that identifies
the high frequency atrial activation during AF. Two, to
determine whether the right atrium is a driver of AF in
certain types of right atrial disease.
|
PAGE
TOP
|
Poor techniques to classify AF and the absence
of a widely accepted classification system are two
problems. The terms paroxysmal, persistent and chronic
provide little information about the pathology of
AF. Further, there is no clear delineation between
the focal and nonfocal mechanisms.
None of the present descriptors of AF are clear
or distinct. It is unclear whether the left or right
atrium is primarily involved, despite talk about
associated heart disease. Whether the AF that results
from heart disease is the same or different is unclear.
The underlying electrophysiologic (EP) properties,
such as zones of slow conduction, dispersion of
refractoriness, and anisotropy, are difficult to
classify. It is unclear how to describe the findings
from intracardiac mapping.
A new mapping technique is needed to identify the
focal drivers of AF. Intracardiac electrocardiograms
are difficult to analyze during AF, due to the lack
of a surface or intracardiac signal to serve as
a marker of when to begin the evaluation. Activation
mapping requires evaluation of multiple sites, which
may be particularly difficult to accomplish in humans,
as is characterizing the maps clearly and succinctly.
The recording duration required to insure reproducibility
is unclear.
|
|
PAGE
TOP
|
Attempts to treat right atrial AF with catheters
introduced into the right atrium have had limited
success. Notably, right atrial ablation is successful
in preventing AF recurrence in some patients, and
seems most likely to be effective when the right
atrium is the "driving force".
AF occurring in the setting of severe tricuspid
regurgitation (right atrial predominant disease)
was studied, as most patients with AF have underlying
heart disease and thus anatomic atrial remodeling.
AF occurring in the setting of combined severe triscuspid
regurgitation and rapid atrial pacing was studied,
as electrical remodeling may occur due to repeated
bouts of paroxysmal atrial fibrillation or tachycardia.
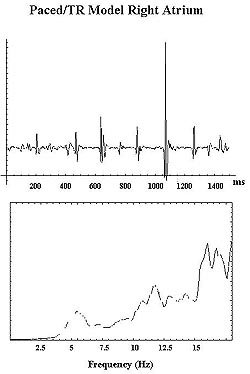
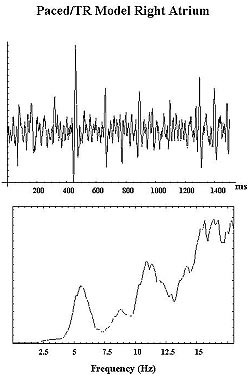
The hypothesis was that right atrial pathology results
in AF with a higher activation frequency in the
right atrium versus the left atrium.
|
|
PAGE
TOP
|
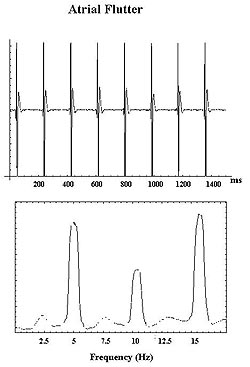
The utility of multisite mapping using a basket
catheter with 32 bipoles was evaluated using the
technique of frequency analysis (analyzing the component
frequencies of a signal) of AF electrograms. The
parameters of interest were 1) the average frequency
of activation in each atrium, 2) peak frequency
of activation in each atrium, and 3) the energy
in each 5-9.5 Hz bandwidth. This corresponds to
a heart rate of 300-570 beats per minute, typical
ranges for AF activation. They began with 32-second
recordings and used this duration to assess the
reproducibility of the results.
Twelve goats
were studied. Three models were studied. One, 3
animals in whom AF was inducible in the baseline
state. Two, 6 animals that underwent only anatomic
remodeling [creation of severe tricuspid regurgitation
(TR)]. Three, 3 animals that underwent anatomic
and electrical remodeling, including severe tricuspid
regurgitation and rapid atrial pacing. All acute
and chronic studies were performed with the animals
intubated, ventilated, and anesthetized with halothane.
Anatomic remodeling was performed via a lateral
incision, with the renal vein identified and cannulated.
Under fluoroscopic guidance, a transvenous hook
catheter was used to create TR until an 8-12 mmHg
increase in right atrial pressure was noted. The
vein was repaired when possible or a nephrectomy
was performed. Anatomic and electrical remodeling
was created by creating TR in the same manner. A
transvenous pacing electrode was positioned via
the jugular vein in the right atrium and attached
to a high rate pacemaker programmed to a rate of
400 bpm.
Baseline testing was performed before TR was created
in the three animals. The other animals returned
to the lab for EP testing after 2-3 months. Echocardiography
documented moderate to severe TR with right atrial
enlargement. The renal vein was again cannulated,
and blood pressure monitored via a catheter positioned
in the renal artery.
A multielectrode (32 bipoles) basket catheter was
positioned under fluoroscopic guidance in the right
atrium via the renal vein. AF was induced by either
burst or programmed stimulation if needed. One-minute
recordings of sustained AF (lasting > 3 min)
were acquired on a digital recorder with a bandpass
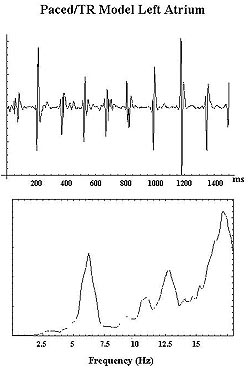
of 3-250 Hz. Transeptal catheterization of the left
atrium was attempted after recording right atrial
AF. The multielectrode basket catheter was positioned
under fluoroscopic guidance. AF was induced by burst
or programmed stimulation if needed. One-minute
recordings of AF were acquired.
|
|
PAGE
TOP
|
Digitally stored data was downloaded from the EP
recording system to a NEXT computer system and analyzed
using Mathematica. The first and last 32 seconds
were analyzed individually to evaluate the reproducibility
of the results. Each 32-second sample was divided
into 8-second sequential 4-second segments of AF
for analysis.
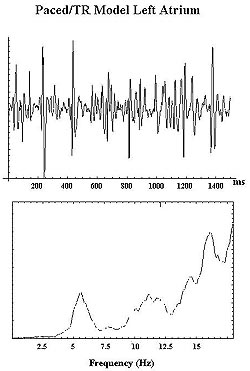
Each 4-second sample underwent mean removal. A
Hanning window was applied and the data was zero-padded
to 8192 points; standard techniques in fast Fourier
transform (FFT) analysis. An FFT was performed on
each 4-second sample from which the power spectrum
was calculated. The 8 power spectra were averaged
and smoothed using a 5-point moving average fitter.
The analysis focused on the 5-9.5 Hz range (300-570
bpm). At each site, the average frequency of activation
was calculated. In each atrium, the average and
peak frequency of activation was calculated. The
energy in the 5-9.5 Hz bandwidth was calculated.
|
|
PAGE
TOP
PAGE
TOP
|
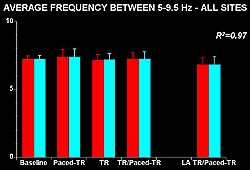 |
| Figure
6. The average frequency in each atrium in the
5-9.5 Hz bandwidth was highly correlated between
the first and second 32 seconds. No difference
in the average frequency in the right atrium between
baseline and the two models was seen (left side
of panel) and no statistically significant difference
between the average frequency in the right and
the left atriums was seen. (Paced-TR, combined
anatomic and electrical right atrial remodeling;
TR, right atrial anatomic remodeling alone; TR/Paced-TR,
composite of right atrial TR and Paced-TR groups;
LA TR/Paced-TR, composite of left atrial TR and
Paced-TR groups.) (Goldberger 2000) |
|
The average frequency in each atrium in the 5-9.5
Hz bandwidth was highly correlated between the first
and second 32 seconds (R2=0.97); the
data are very reproducible (Fig. 6). No difference
in the average frequency in the right atrium between
baseline and the two models was seen. No statistically
significant difference between the average frequency
in the right and the left atriums was seen.
The peak frequency in each atrium was above 8 Hz
(Fig. 7). The correlation between the first and
second 32 seconds was quite high (R2=0.88).
No differences between any of the models in the
right atrium were seen, or any statistically significant
differences between left and right atriums in the
peak frequency of activation. The correlation for
the energy under the curve in the 5-9.5 Hz range
was slightly less (R2=0.76) (Fig. 8).
A fair amount of dispersion in the data seemed to
be present between the baseline and the right atrium
and the left atrium with large standard deviations
(Fig. 8).
|
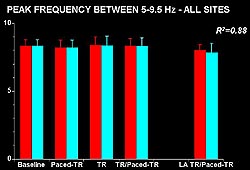 |
| Figure
7. The peak frequency in each atrium was above
8 Hz, slightly higher than the average frequency,
and the correlation between the first and second
32 seconds was quite high. No differences were
seen between any of the models in the right atrium
or any statistically significant differences between
left and right atriums. (Goldberger 2000) |
|
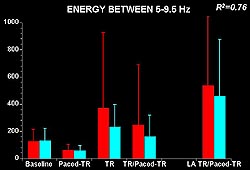 |
| Figure
8. The correlation for the energy under the
curve in the 5-9.5 Hz range was slightly less,
compared to the correlations for the average
and peak frequencies. A fair amount of dispersion
in the data seems to be present between the
baseline and the right atrium and the left atrium
with large standard deviations. (Goldberger
2000) |
|
|
PAGE
TOP
Limitations
and conclusions |
|
Study limitations include the small numbers in
each group. Although the basket catheter records
from multiple atrial sites, it is possible that
the site responsible for driving AF (highest activation
frequency) may be remote from any of the recording
sites. Differences in spontaneous versus induced
episodes may exist.
In conclusion, despite the presence of right atrial
structure abnormalities, high frequency AF was not
confined to the right atrium. This suggests that
even in this setting, the right atrium may not necessarily
be the driving force of the AF. Frequency analysis
of AF electrograms is useful to identify the local
activation frequency of AF. The frequency data are
highly reproducible. Frequency analysis is an efficient
way to map AF during episodes of AF.
|
|
PAGE
TOP
Report
Index | Previous Report
| Next Report
Scientific
Sessions | Activities
| Publications
Index
Copyright © 2000
Japanese Circulation Society
All Rights Reserved.
webmaster@j-circ.or.jp
|