 |
|
|
|
IS147
Coronary
Pressure Measurement and Fractional Flow Reserve |
|
Nico H.J. Pijls, M.D., Ph.D.
Department of Cardiology
Catharina Hospital
Eindoven, The Netherlands |
|
|
|
|
|
|
|
|
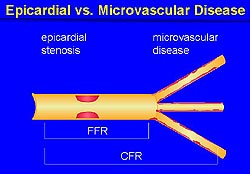 |
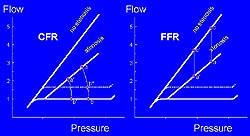
Figure 1.
Fractional flow reserve and coronary flow reserve are
complementary measures that inform about the physiology
and microvascular disease. (FFR, fractional flow reserve,
CFR, coronary flow reserve.) Pijls 2000.
Click to enlarge |
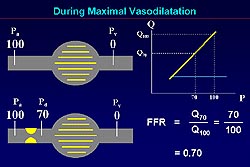 |
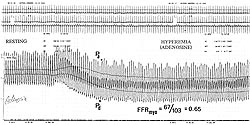
Figure 2.
The linear relation between perfusion pressure of the
myocardium and blood flow (normal, upper left panel;
stenosis, lower left panel). Maximal blood flow in stenosis
compared to normal is reflected in the ratio of the
perfusion pressures (right panel). (Pa, aortic pressure;
Pd, diastolic pressure; FFR, fractional flow reserve.)
Pijls 2000.
Click to enlarge |
|
Fractional flow reserve (FFR) as a specific
index of the epicardial artery and thus a very practical
tool for decision-making was the focus of this lecture.
FFR does not completely describe the physiology; coronary
flow reserve (CFR) is required as it takes into account
microvascular disease (Fig.1). However, decreased CFR
can not distinguish between microvascular disease and
epicardial disease. Thus, physiologically and scientifically,
it is good to have both parameters. To make practical
decisions in the catheterization laboratory when determining
whether a coronary intervention will be useful, FFR is
usually sufficient.
At maximal vasodilation a linear relation
between perfusion pressure of the myocardium and blood
flow exists. Thus, in a normal system with a normal epicardial
and myocardial vascular bed, the perfusion pressure across
the myocardium is 100 mm Hg (Fig. 2, upper left panel).
In the case of stenosis, for example, the gradient and
recognizing that distal perfusion pressure has decreased
are more important (Fig. 2, lower left panel. The ratio
of the perfusion pressures (FFR=Pd/Pa) reflects the maximal
blood flow in stenosis compared to that in the normal
setting, because of the proportionality between pressure
and flow at maximal vasodilation (Fig. 2, right panel).
FFR is the ratio of maximal myocardial perfusion with
stenosis divided by the theoretical value of the normal
situation, i.e., maximum myocardial perfusion without
stenosis.
|
PAGE
TOP
FFR in
the catheterization laboratory |
|
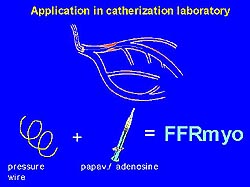 |
Figure
3. To measure fractional flow reserve (FFR) in
the catheterization laboratory, a pressure wire
is placed across the stenosis and an adequate
hyperemic stimulus administered. One recording
of the proximal and distal pressure allows for
calculating the FFR. (Pijls 2000)
Click to
enlarge |
 |
Figure
4. Illustration of measuring flow reserve under
maximal hyperemia. (Pa, aortic pressure; Pd, distal
pressure; FFR, fractional flow reserve; CFR, coronary
flow reserve). Pijls 2000.
Click to
enlarge |
 |
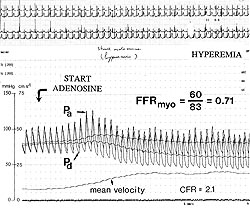
Figure
5. Intravenous adenosine increases the small resting
gradient to a large gradient of hyperemia and
good steady state, allowing calculation of the
FFR. (Pa, aortic pressure; Pd, distal pressure;
FFRmyo, myocardial fractional flow reserve). Pijls
2000.
Click to
enlarge |
|
To obtain these measures in the catheterization
laboratory a pressure wire is placed across the
stenosis, an adequate hyperemic stimulus administered,
and one recording of the proximal and distal pressure
is obtained to calculate the FFR (Fig. 3). Two phasic
and two mean signals are obtained. One is recorded
by the guiding catheter (aortic pressure), and the
other by the pressure sensor, across the stenosis.
In cross-sectional lesions, clear
pressure decreases are seen. Information about stenosis
severity and exact lesion location are provided
by the registrations. When overprojection or other
angiographic problems cause difficulty in interpretation,
hemodynamic information can determine the location
of the problem. Essential for this concept is the
presence of maximal hyperemia, required to unmask
the true severity of a stenosis. When flow is increased,
the distal pressure is decreased (Fig. 4), and FFR
can be calculated by taking the mean distal pressure
divided by the mean proximal pressure. Useful stimuli
include intracoronary papaverine, intracoronary
adenosine, intravenous adenosine, intracoronary
ATP, and intravenous ATP. The presently used doses
are higher than those recommended in the past, but
if used carefully valuable measures of FFR can be
obtained.
An example with intravenous adenosine
showed that the small resting gradient increases
to a large gradient of hyperemia and good steady
state, allowing calculation of the FFR (Fig. 5).
In diffuse disease or for multiple lesions along
a coronary artery, this method of inducing hyperemia
is convenient as it allows for starting in the distal
coronary artery with the pressure sensor and making
a slow pullback curve during continuous hyperemia,
yielding good quality information about whether
disease is present and its location.
Similar results are achieved with
the difference hyperemic stimuli, regardless of
route or site of delivery, based on Pd/Pa ratios.
Only the contrast agent is an inadequate stimulus
and should not be used as an alternative to adenosine.
|
|
PAGE
TOP
|
| |
The theoretical unequivocal normal
value for FFR is 1.0. This value has been validated
by Pijls and colleagues in their study of FFR in
33 coronary arteries in 8 normal persons. Their
coronary angiograms, dobutamine echocardiograms
and LV function were all normal. In a normal coronary
artery, there is no decline of pressure from the
proximal to distal part of the coronary artery,
and the normal FFR range was found to be 0.98 +
0.2 (range 0.94-1.02).
|
 |
Figure
6. Fractional flow reserve is independent of changes
in blood pressure and heart rate. Coronary flow
reserve will change, although the stenosis does
not change (left panel). Heart rate activity increases
do not affect this ratio (right panel). Pijls
2000.
Click to
enlarge |
|
FFR is independent of changes in blood
pressure and heart rate. CFR is defined as maximum
blood flow in the presence of stenosis divided by
baseline blood flow. If blood pressure decreases,
CFR will change to A prime divided by B prime. If
heart rate increases, the baseline pressure-flow
relationship level increases, and the CFR is A divided
by B prime squared. CFR will change, although the
stenosis does not change (Fig. 6, left panel). FFR
is defined as maximum blood flow in the presence
of a stenosis divided by normal maximal blood flow.
If blood pressure decreases, A prime is divided
by C prime, which is still the same ratio. Heart
rate activity increases do not affect this ratio,
and has been validated in patients with heart rates
between 50 and 150 beats per minute (Fig. 6, right
panel).
FFR values and ischemia
An FFR below 0.75 is associated with
inducible ischemia if the patient is sufficiently
stressed. For the most part, inducible ischemia
is not possible with an FFR above 0.75, with a specificity
of 100% and sensitivity of 90%. In 10% of patients,
it may be possible to induce ischemia with an FFR
above 0.75. A number of diseases contribute to this,
including microvascular disease.
|
|
PAGE
TOP
FFR and
coronary interventions |
|
FFR can be useful to determine whether
a coronary intervention will beneficial. For example,
in a patient with an intermediate left anterior
descending (LAD) stenosis, two equal signals were
recorded at one location, showing no resting gradient.
With hyperemia only a small gradient develops (FFR
= 0.89). This lesion is not responsible for the
angina.
Is it safe to defer percutaneous coronary
angioplasty for such a lesion? Thallium testing
has shown that the strongest prognostic predictor
is the presence and extent of inducible ischemia.
Thus, the past studies suggest that only hemodynamically
significant lesions should be dilated. The DEFER
study was conducted to investigate this question
with invasive measurements. This prospective, randomized
study was conducted in 325 patients with an equivocal
stenosis in a large coronary artery. In the 40%
of patients with an FFR less than 0.75, a PTCA was
performed. The patients with an FFR above 0.75 were
randomized to either receiving a PTCA or PTCA was
deferred.
Interestingly, the survival curve
of the reference group (patients with an FFR less
than 0.75) showed that the one year event-free survival
was 81%. About 20% of these patients have either
an event or revascularization within the next year.
The one-year recurrence rate after single vessel
PTCA is 20%, which is acceptable as the patients
receive much functional benefit from PTCA. This
was also seen in the reference group (FFR <0.75)
in the DEFER study, with only 10% being angina-free
at the beginning of the study and more than 70%
were angina-free after one year. In a normal population
at the same age, the expected one-year cardiac event
rate is 1.5%. In the patients with a deferred PTCA,
the event free survival was 93%. This 7% event rate
is not high in absolute terms, but it is still 5-fold
higher than in a healthy population. In the PTCA
group, the event rate was 11%. Thus, these patients
do not derive benefit from the angioplasty. Importantly,
between the three groups there was no significant
difference in functional class after one year.
The DEFER results show that a PTCA
should be performed in patients with hemodynamically
significant lesions to provide functional benefit,
but this will not necessarily improve prognosis.
If a lesion is not hemodynamically significantly,
patients do not derive benefit from PTCA and medical
treatment can be used which is safer and results
in a better outcome.
FFR can also be used to evaluate balloon
angioplasty. In patients with an FFR greater than
0.9, the 2-year restenosis rate was 2.5 fold lower
than in those patients with an FFR less than 0.9.
An FFR less than 0.75 represents an insufficient
PTCA result. An FFR of 0.75-0.90 represents a suboptimal
PTCA result and is associated with a one-year restenosis
rate of 30%. Stenting could be considered. An FFR
above 0.90 is a stent-like result and is associated
with a one-year restenosis rate of 10%. This correlates
well with the data from the DEBATE and DESTINI trials.
Stenting
A study of FFR after coronary stenting
by Hanekamp and colleagues showed that a high post-stent
FFR (greater than 0.94) corresponds to a good IVUS
result. However, it was possible to obtain such
a good result in only 64% of the patients. A post-stent
FFR greater than 0.90 is associated with a moderate
restenosis rate and was achievable in 84% of patients
in this study. In the case of disease elsewhere
in the vessel, the post-stent FFR should be represented
by the pullback curve across the stent itself, because
a residual gradient can also originate more distal
or proximal to the stent. In a diagnostic setting,
0.75 is the threshold for intervention. A post-intervention
FFR of at least 0.90 should be achieved. If this
can not achieved with PTCA, stenting should be performed.
|
|
PAGE
TOP
Use of
FFR in special settings |
|
More complex coronary artery disease
in which FFR has proven useful was reviewed. In
a patient referred for PTCA for a mid-LAD lesion,
because of concern of stenosis in another region,
a pressure wire was placed far down into the LAD
and a pullback curve was made during maximal hyperemia.
In the distal LAD there was a large gradient with
an FFR of 0.5. During sustained hyperemia there
was a gradient at the site of the mid-LAD lesion,
but a much larger gradient at the site of the proximal
LAD lesion. Thus, the patient was referred to mid-CAB
surgery, which was successful. It is possible to
calculate the degree of influence of each of the
lesions.
FFR can be especially useful in diffuse
disease. In a patient with angina and a positive
exercise test referred for PTCA, Pijls and colleagues
first placed a pressure wire in the distal circumflex
and the distal LAD to make pullback curves. In the
proximal area of the left main, there was no pressure
gradient. A large gradient in the distal LAD was
found, and on the pullback curve a gradual decline
of pressure. The pressure measurements inform that
PTCA is not possible and medical therapy is warranted.
The acute phase of myocardial infarction
is very dynamic. Pressure measurements are not useful
during the first 48 hours of infarction. Treatment
should be guided by clinical symptoms and ECG. After
the artery has stabilized, pressure measurements
can be useful. This was demonstrated in a 55-year
old woman 6 days post Q-wave anterior infarction.
On cardiac catheterization, the anterior wall was
akinetic. Two questions must be answered: the amount
of viable myocardium and whether the residual lesion
is significant. Pressure measurements showed a resting
gradient of 10 mm, and a large increase is seen
after infusing adenosine, indicating preserved vascular
reactivity in the anterior wall and viability. The
rather low FFR indicates that the residual lesion
is still hemodynamically significant. This has been
validated in 40 patients. An FFR above 0.75 has
been shown to be associated with a negative MIBI
Spect scan.
Fractional collateral blood flow is
the portion of the blood flow that goes to the myocardium
through the collaterals, compared to that going
through the coronary artery. . Coronary measures
can distinguish these flow patterns. Fractional
collateral flow is maximum recruitable collateral
blood flow expressed as a fraction of normal maximal
flow: (Pw - Pv/Pa - Pv). If this ratio is above
approximately 0.3, there is a 6-fold lower chance
of a myocardial infarction occurring during a follow-up
of 3-5 years.
|
|
PAGE
TOP
Report
Index | Previous Report
| Next Report
Scientific
Sessions | Activities
| Publications
Index
Copyright © 2000
Japanese Circulation Society
All Rights Reserved.
webmaster@j-circ.or.jp
|
|