 |
|
|
|
IS044
Use of 3-Dimensional Echocardiography
in Coronary Artery Disease |
|
Jiefen Yao, M.D.
Division of Cardiology
New England Medical Center
Tufts University School of Medicine
Boston, Massachusetts |
|
|
|
|
|
|
|
|
The structure, blood flow and function of the heart have
multiple dimensions. Although 2-dimensional echocardiography
(2DE) has been widely used in the diagnosis and evaluation
of coronary artery disease (CAD), limitations exist in
extrapolating information from a few selected imaging
planes and applying it to the whole heart. This usually
requires mental reconstruction of 3-dimensional (3D) images
of the heart from 2DE. We explored the use of 3-dimensional
echocardiography (3DE) in CAD both experimentally and
clinically.
|
PAGE
TOP
Methods of
3DE Data Acquisition (Figure 1) |
|
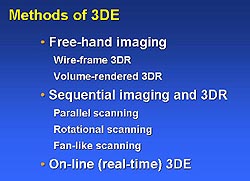 |
| Figure
1. Methods used in 3-dimensional echocardiography
(3DE). (Yao 2000) |
|
Free-hand imaging usually employs a spatial sensor
device (including a transmitter and a receiver of
acoustic or magnetic signals) to locate the spatial
position of the imaging plane, while the ultrasound
transducer can be moved manually to scan the heart.
Sequential imaging often requires a motor device
fixed to the ultrasound transducer. The movement
of the device is controlled by a computer in order
to scan the heart in a sequential, step-wise manner
such as parallel, rotational or fan-like scanning.
Another way of sequential imaging is to employ a
multiplane transducer (such as multiplane transesophageal
transducer) that scans the heart rotationally without
the need of a motor device.
Real-time imaging applies a volumetric ultrasound
transducer that images the heart in 3 dimensions
and acquires a 3DE data set in real-time.
|
|
PAGE
TOP
3DE Data
Analysis, Display and Quantitation (Figure 2) |
|
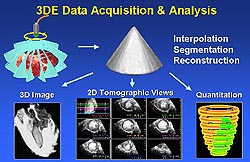 |
| Figure
2. Methodology for 3-dimensional echocardiography
(3DE) data acquisition, display and quantitation.
(Yao 2000) |
|
The raw images acquired in the above manner are
processed to produce volumetric data sets. These
data sets can then be reconstructed and displayed
in various formats including cross-sectional views
and volume-rendered 3D images. Region of interest
can be extracted and displayed individually. Area
and volume of a given region can be measured from
the 3DE data sets. The volume of a given region,
such as a dysfunctional region of the left ventricle,
is usually measured from a 3D data set in the following
way. First, a short-axis view of the left ventricle
is defined and multiple cutting planes parallel
to the short-axis view are derived with equal intervals
to divide the left ventricle into multiple slices;
or, a long axis of the left ventricle is derived
and multiple short-axis views are then derived perpendicular
to the long-axis view. Second, each short-axis view
of the left ventricle is played in a dynamic mode
for the observer to recognize the dysfunctional
region, which is then traced and a volumetric label
is given. Third, after all the dysfunctional regions
are traced in all slices, the volume of the dysfunctional
myocardial mass on each slice and on all left ventricular
slices is calculated automatically. The volume of
the total myocardial mass of the left ventricle
can be measured in a similar way, only that the
total myocardial regional is traced on each slice.
Therefore, the percentage of the left ventricle
involved in dysfunction can also be derived. Similarly,
the volume and ejection fraction of the left ventricle,
the volume of abnormal perfusion defect mass can
be assessed as well.
|
|
PAGE
TOP
Application
of 3DE in the Evaluation of CAD |
|
3D assessment of regional wall motion abnormality.
CAD often manifests left or right ventricular regional
wall motion abnormalities. The location, extent
and severity of these abnormalities vary from case
to case. 3D display and quantitative assessment
of these abnormalities can be helpful in understanding
the location of the coronary disease(s), extent
of the myocardium involved in dysfunction and even
the mechanism of the complications such as mitral
valve regurgitation. In an experimental study of
acute myocardial infarction induced by coronary
artery occlusion in canine models, a good correlation
was obtained between the dysfunctional mass and
the anatomically determined infarct mass.1
In a clinical study, dysfunctional mass from 3DE
correlated well with that from magnetic resonance
imaging.2
Not only can regional wall motion be demonstrated
in multiple cross-sectional views of the 3DE data
set, but also dynamic volume-rendered images of
the ventricles can be reconstructed and displayed
and the region of abnormal wall motion visualized.
Using an automated regional ejection fraction analysis
program, the quantitative process is expedited and
facilitated. The 3D information of regional wall
motion of the whole left ventricle can be displayed
in a simple bulls-eye format. Tissue Doppler has
emerged as a new modality of imaging the myocardial
function. When 3D data is acquired in this mode,
the regional function of the left ventricle can
be displayed and evaluated in 3 dimensions in tissue
Doppler mode.
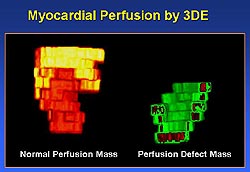
3D assessment of myocardial perfusion.
Contrast enhanced 2DE has proven to be useful
in evaluating regional myocardial perfusion abnormalities
in ischemic animal models and in patients with coronary
artery disease. To obtain optimal myocardial contrast
enhancement throughout the process of 3DE data acquisition,
a steady status of the contrast enhancement is required.
This can be achieved in the following ways: One
is to maintain a steady concentration of contrast
in the circulation by giving the intravenous contrast
agent as a slow bolus or by continuous infusion
of the contrast agent. Another one is to minimize
destruction of the contrast by ultrasound and to
prolong myocardial enhancement time by using triggered
imaging or by lowering ultrasound out-put power,
such as the newly developed real-time perfusion
imaging. Last, 3DE data acquisition time can be
reduced by using real-time 3DE or other fast data
acquisition methods.
|
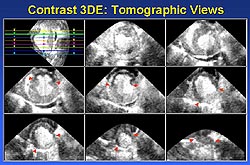 |
| Figure
3. An example of a cross-sectional display and
quantitation of a myocardial perfusion defect
using contrast enhanced 3DE. (Yao 2000) |
 |
| Figure
4. An example of a 3D reconstruction of a myocardial
perfusion defect. (Yao 2000) |
|
The contrast enhanced 3DE data can be used for
display and measurement of myocardial perfusion
abnormalities in ways similar to that used in conventional
3DE for regional wall motion analysis. The perfusion
defect can be displayed and quantified in cross-sectional
views (Figure 3). In addition, the defect can be
displayed in 3D reconstruction (Figure 4) as well
as in bulls-eye presentation (Figure 5).3
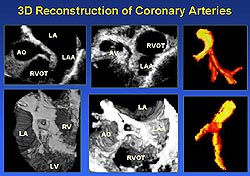
3D reconstruction of coronary arteries. 3DE
data of coronary arteries can be obtained via transesophageal
or transthoracic imaging. The coronary arteries
can be reconstructed and presented in cross-sectional
views, volume-rendered 3D images or in extracted
cast-like display format (Figure 6).4
Our clinical study demonstrated the feasibility
of 3D reconstruction and displaying coronary arteries
and the ability of 3DE in recognizing stenotic lesions
in the proximal coronary segments.
|
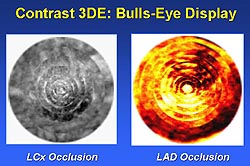 |
| Figure
5. An example of a bulls-eye display of a myocardial
perfusion defect. (Yao 2000) |
|
 |
|
Figure
6. The coronary arteries can be reconstructed
and presented in cross-sectional views, volume-rendered
3D images or in extracted cast-like display
format. (Yao 2000)
|
|
|
PAGE
TOP
|
The 3DE technique is being developed rapidly in
all its facets, including data acquisition, data
processing, image reconstruction and quantitative
analysis. 3DE is getting faster and easier to perform.
Many ultrasound machine manufacturers are incorporating
3DE ability into their products, so that 3DE data
can be collected during 2DE examinations. Other
imaging modalities including contrast enhanced imaging,
tissue Doppler imaging, metabolic imaging, electrophysiologic
imaging and so on are also being developed in 3D
formats. An ideal technique in the future for the
evaluation of CAD is one that provides comprehensive
information of the heart in a multi-dimensional,
multi-functional and multi-modality format.
|
|
PAGE
TOP
References
- Yao J, Cao QL, Masani N, Delabays A, Magni
G, Acar P, Laskari C, Pandian NG. Three-dimensional echocardiographic
estimation of infarct mass based on quantification of dysfunctional
left ventricular mass. Circulation 1997;96(5):1660-6.
- De Castro S, Yao J, Magni G, Cacciootti L,
Trambaiolo P, De Sanctis M, Fedele F. Three-dimensional echocardiographic
assessment of the extension of dysfunctional mass in patients
with coronary artery disease. Am J Cardiol 1998;81(12A):103G-106G.
- Yao J, Teupe C, Takeuchi M, Avelar E, Shaehan
M, Connolly R, Ostenson J, Pandian NG. Quantitative 3-dimensional
contrast echocardiographic determination of myocardial mass
at risk and residual infarct mass after reperfusion: experimental
canine studies with intravenous contrast agent NC100100. J
Am Soc Echocardiogr 2000;13:570-581.
- Yao J, Taams MA, Kasprzak JD, de Feijter PJ,
ten Cate FJ, van Herwerden LA, Roelandt JRTC. Usefulness of
three-dimensional transesophageal echocardiographic imaging
for evaluating narrowing in the coronary arteries. Am J Cardiol
1999;84(1):41-45.
Report
Index | Previous Report
| Next Report
Scientific
Sessions | Activities
| Publications
Index
Copyright © 2000
Japanese Circulation Society
All Rights Reserved.
webmaster@j-circ.or.jp
|
|