 |
|
|
|
| New Developments in Echocardiography: Recent Advances in Technology and
Challenges to Ischemic Heart Disease |
|
Shintaro Beppu
Osaka University, Suita,
Japan
Young-Jae Lim
Kawachi General Hospital,
Higashi-Osaka, Japan
Hiroyuki Watanabe
Osaka City University Graduate
School of Medicine, Osaka, Japan |
|
|
|
|
|
|
|
|
Myocardial Contrast Echocardiography Investigation of the Coronary Circulation |
|
Myocardial contrast echocardiography (MCE) had been
limited by the requirement for direct injection of
the contrast agent into the coronary artery. However,
myocardial opacification is now possible with venous
injection. The use of MCE for the diagnosis of coronary
stenosis and investigating the microcollaterals and
coronary tree are expanding its use.
|
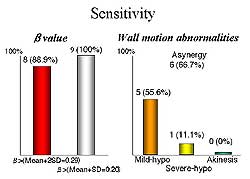 |
| Figure
1. Comparison of the sensitivity of detecting
coronary stenosis using the slope of the replenishment
curve and the wall motion abnormalities. |
| Click
to enlarge |
|
The concept of coronary flow reserve is used to diagnose
coronary stenosis. Hyperemia is caused by dipyradimole
or ATP and then real-time perfusion imaging using
high-energy ultrasound and microbubbles allows for
calculating the replenishment curve. In the basal
state, the replenishment curve is nearly identical
between the normal controls and the area at risk.
But the curves differ greatly under ATP. The sensitivity
for detecting coronary stenosis using the slope of
the replenishment curve is very high in the range
of 88-100%, compared to using wall motion abnormalities
in the range of 11-55% (Figure 1).
|
|
A diagnostic tool for myocardial ischemia is available
for each stage of the ischemic cascade that follows
reduced coronary flow: MCE for decreased myocardial
perfusion; positron emission tomography (PET) for
anaerobic metabolism; Doppler ultrasound for diastolic
dysfunction; 2-dimensional echocardiography for wall
motion abnormality; and electrocardiogram for electrical
changes. However, calculation of the replenishment
curve is time consuming. Hence, the difference between
the area under the curve (stenosis present) and the
area above the curve (stenosis absent) is informative.
Thus, parametric imaging provides good demonstration
of the area at risk, with images quite similar to
those obtained with thallium SPECT imaging.
Microcollaterals are essential for myocardial
salvage, while the presence of angiographically-proven
collaterals is not crucial. For the calculation of
the microcollaterals, three regions in the area at
risk are identified and the collaterals are classified
into 1 of 4 categories: none, poor, fair, good. Asynergy
is also classified, as normal, mild hypokinesis, severe
hypokinesis, and akinesis. The total score is calculated
by adding the scores for the three different regions.
A good correlation between the collateral score and
wall motion score has been demonstrated.
Clinically, a mean arterial pressure (MAP) of less
than 80 mmHg after nitroglycerin administration is
associated with a larger area of myocardial damage,
compared to a MAP greater than 80 mmHg after nitroglycerin
administration. The blood pressure level effects the
opacification; compared to the opacification achieved
with a control blood pressure of 92 mmHg, opacification
is worsened when the blood pressure is reduced with
nitroglycerin to 65 mmHg but improved when the blood
pressure is increased to 133 mmHg. Yet, a further
increase in blood pressure to 152 mmHg worsens the
opacification, similar to that seen with a blood pressure
of 92 mmHg, showing the delicate nature of the effect
of blood pressure on collaterals. A J-curve effect
exists in relation to the blood pressure, in which
a high or low blood pressure level is associated with
poor collateral flow, while a blood pressure of 140
mmHg is associated with good collateral flow. In the
normal coronary artery, there is a curvilinear relationship
between coronary perfusion pressure and coronary flow
volume. But in the collaterals, there is a reverse
J curve phenomenon.
MCE is the only tool for detection of microcollateral
vessels, which are responsible for wall motion abnormality
in a region of coronary occlusion. The microcollateral
region is characterized by an ischemic zone with a
core and border zone, slow blood filling, and blood
pressure-dependency, such as a reversed J response
or loss of autoregulation of coronary flow.
Visualization of the coronary tree is possible,
and the acoustic power used determines which vessels
can be imaged, since the video intensity depends on
flow speed and acoustic power. 3-D imaging allows
visualization of the arteriolar plexus. Doppler should
be used for imaging the stem and branches of the coronary
tree, and contrast echo with changes in the acoustic
power for the fine branches of the tree. Clearly,
beyond myocardial opacification, MCE is a powerful
tool for investigating the coronary circulation.
|
PAGE
TOP
|
Coronary Tree Assessment with Contrast Harmonic Imaging |
|
Harmonic imaging (HI) represents one of the recent
revolutions in echocardiography. Myocardial contrast
echocardiography (MCE) is performed intravenously
using intermittent imaging. Third-generation harmonic
imaging has provided real-time MCE. Determining the
degree of myocardial blood flow in each level of the
coronary tree is the goal of MCE.
Young-Jae Lim and colleagues at Kawachi General
Hospital in Higashi-Osaka, Japan investigated the
use of different frame rates in MCE to visualize the
coronary tree, with the hypothesis that a higher frame
rate to increase the destruction of microbubbles would
image only faster flow. Other investigators have used
higher acoustic power to visualize the coronary tree.
In 20 patients with ischemic heart disease (IHD)
the three different frame rates for visualizing the
coronary tree were: 1) intermittent, slow frame rate;
2) semi-real time, intermediate frame rate; 3) real
time, fast frame rate. Levovist was used in the third-generation
HI.
Intermittent imaging consisted of a pulse interval
of 1:1 to 1:8 to detect slow flow. Clear visualization
of the infarct area was achieved with intermittent
imaging. Third-generation HI was very sensitive to
the signal from the microbubbles, compared to second
generation HI. Blood volume and blood velocity could
be calculated from the replenishment curve by changing
the pulse interval. Using intermittent imaging, curve
fitting was possible in 76.5% of the targeted region
of interest. Blood volume was 5.3 ±3.8 and
the blood velocity was 1.0± 1.0. Capillary
circulation could be assessed with slow frame rate
MCE.
|
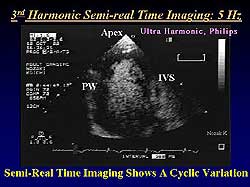 |
| Figure
2. 3rd Harmonic semi-real time imaging in a patient
with an anterior septal myocardial infarction
showed rapid filling in the normal areas and delayed
filling via collateral channels in the infarcted
areas. |
| Click
to enlarge |
|
Semi-real time
imaging at 5 frames per second detected intermediate
speed flow. A representative case, in a patient with
an anterior septal myocardial infarction (MI), showed
rapid filling in the normal areas and delayed filling
via collateral channels in the infarcted areas (Figure
2). Moreover, a cyclic variation could be seen, in which
myocardial staining increased in diastole and decreased
in systole. |
|
The visual score for myocardial staining was only
1.0 ± 0.6 in the infarct region, compared to
1.5 ± 0.55 in the normal region (p<0.05).
Moreover, analysis of cyclic variation in normal and
infarcted regions showed a greater change in cyclic
variation in the normal areas (50dB peak intensity
(PI) at end diastole, 30 db PI at end systole; p<0.05)
compared to the infracted areas (25 dB PI at end diastole,
12 dB at end systole). In summary, semi-real time
perfusion imaging at 5 Hz showed more rapid flow in
the capillaries; compression of arterioles may result
in cyclic variation; pre-capillary circulation may
be damaged during infarction. Pre-capillary circulation
could be visualized with semi-real time perfusion
imaging.
Real-time imaging at 26 frames per second was used
to detect fast flow, with the goal of visualizing
intramyocardial small vessels. The septal perforator
was visualized. Real-time imaging at this speed resulted
in vascular, not perfusion, imaging. Line-form small
artery flows were detected in 80% of viable areas.
Doppler evaluation could be possible for small arteries.
Thus, a high frame rate vascular image could
assess small artery flow.
The investigators concluded that MCE at different
frame rates visualizes coronary flow at different
flow velocities. Intermittent imaging using a low
frame rate visualized coronary circulation and no
cycle variation. Semi-real time imaging using an intermediate
frame rate visualized pre-capillary circulation, including
arterioles and venules. Real-time imaging using a
high frame rate visualized small artery circulation.
Hence, echocardiography can non-invasively assess
all rates of flow of the coronary tree. They suggest
real-time imaging for small arteries, semi-real time
for pre-capillary vessels, intermittent imaging for
capillaries, and Pulse Doppler transthoracic echocardiography
for epicardial coronary arteries.
The assessment of absolute myocardial blood volume
(MBV) in the coronary tree may be possible. Yamada
and colleagues reported a novel method for estimating
MBV using the ratio of the signal intensity in the
myocardium versus blood. Relative amplitude can be
measured as the brightness of the myocardium minus
the brightness of the blood. Thus, the absolute MBV
can be calculated using this equation: 10RelAmp/10X100
(ml/100cm3). Tanaka and colleagues reported that the
triggering method in MCE gives the absolute MBV in
capillary flow, while semi-real time imaging at 5
Hz provides absolute MBV in pre-capillary flow.
Clinically, 3-staged intravenous MCE provides non-invasive
imaging from the small artery to the capillary bed.
Thus, the entire flow of the coronary tree can be
assessed. Yet, some limitations must be addressed
for this to be an established clinical tool, including
stronger myocardial opacification, better reproducibility,
lesser attenuation and shadow, elimination of LV opacification,
and true-real time imaging. On the horizon, real-time
imaging with a newly available 1.5 HI appears to allow
visualization of defects despite coronary reflow.
|
PAGE
TOP
|
Non-Invasive Assessment of Coronary Flow by Transthoracic Doppler Echocardiography |
|
Coronary flow assessment is useful in the evaluation
of ischemic heart disease (IHD) and variation in coronary
microcirculation. Images obtained by transthoracic
Doppler echocardiography (TDE) allow for visualization
of the colored Doppler signal throughout diastole
and the flow signal in the left anterior coronary
artery. TDE is real-time, easy, accurate and cost
effective. Pulse Doppler provides for measurement
of flow velocity.
Hiroyuki Watanabe, MD, reviewed research by investigators
at Osaka City University Graduate School of Medicine
with TDE for the diagnosis of coronary artery disease
(CAD) and assessment of the coronary microcirculation.
These data, with that from other investigators worldwide,
show TDE to be an important clinical tool for the
noninvasive and physiological evaluation of the coronary
circulation.
These investigators compared coronary flow reserve
(CFR) measures as obtained by TDE and the validated
measures obtained with 201-TI SPECT imaging. Of 12
patients who were SPECT-positive, 11 were CFR positive
on TDE, with a threshold of 2.0. Of 21 SPECT-negative
patients, 19 were CFR negative on TDE. The sensitivity
and specificity of TDE, compared to SPECT imaging,
was 92% and 90% respectively. The positive predictive
value was 85% and the negative predictive value was
95%.
In patients with angina, Doppler guide wire measurement
for severe stenosis (>85% diameter stenosis)
was shown to have a specificity of 77.9% and sensitivity
of 77% for a cut-of value of 1.5. Despite the somewhat
limited values, the advantage is that stress is not
required.
In a study of 296 patients, TDE showed reverse flow
in 22 patients and forward flow in 274 patients. In
the patients with reverse flow, coronary angiography
revealed occlusion in the left anterior descending
(LAD) in 16 patients and in the septal branch in 6
patients, and occlusion in one patient with forward
flow. For the LAD, TDE compared to coronary angiography
for the assessment of flow direction has a sensitivity
of 70% and only 26% for the septal branch. However,
combining the LAD and septal branch yields a sensitivity
of 96%. CFR measurement by TDE accurately reflects
the physiological severity of the coronary narrowing
as well as anatomical severity.
Flow estimation and coronary flow visualization in
the right coronary artery and left circumflex by TDE
was successful in the hands of these investigators,
showing TDE to be a promising technique to diagnose
significant stenosis in the three major coronary arteries.
In their research in assessing the coronary microcirculation
with TTDE, they showed that passive smoke decreased
CFR to about 3.4 in non-smokers, which was about the
same level seen in smokers after exposure to passive
smoke. The smokers had a lower baseline CFR compared
to non-smokers (3.6 versus 4.4, respectively). The
investigators say this provides direct evidence that
passive smoke is harmful for the coronary microcirculation
in nonsmokers. CFR was decreased at 5 hours after
a single high fat meal to 3.3 from 4.0 at baseline.
Estrogen had no effect on CFR in men, while it increased
CFR in both pre- and post-menopausal women. Additional
studies showed that vodka and white wine had no effect
on CFR in 15 volunteers, however, CFR was significantly
increased from 3.0 to about 5.0 after consumption
of red wine, which may be one of its important cardioprotective
effects. These studies show that coronary flow assessment
by TDE can be used for the assessment of the coronary
microcirculation in subjects without coronary narrowing.
.
|
PAGE
TOP
|
Report
Index | Previous Report
| Next Report
Scientific
Sessions | Activities
| Publications
Index
Copyright © 2002
Japanese Circulation Society
All Rights Reserved.
webmaster@j-circ.or.jp
|
|