|
|
|
|
| Therapeutic Strategy for Intractable Ventricular Arrhythmias |
|
|
|
|
|
Noninvasive Strategies in Identifying Patients at Risk for Life-Threatening Arrhythmic Events
Takanori Ikeda
Toho University Ohashi Hospital, Tokyo, Japan
|
|
The precise identification
of patients at risk for sudden cardiac death (SCD)
is crucial for the cost-effective application of prophylactic
implantation of implanted cardioverter defibrillator
therapy (ICD) for improving survival in post-infarction
patients. Various noninvasive markers have been proposed
as risk stratifiers for SCD. These include left ventricular
ejection fraction (LVEF), Holter ECG 9PVC ≥
10/hr, nonsustained ventricular tachycardia (NSVT),
late potentials by signaling ECG,, QT dispersion,
autonomic activity, and µV-level T-wave alternans
(TWA).
A prospective study
to assess the predictive value of 11 noninvasive prognostic
variable for arrhythmic events
in patients with acute myocardial infarction (MI)
was performed by Ikeda and colleagues.
The mean age of
the 372 patients was 63 years, 82% male. The infarction
site was the anterior wall in 254 patients. Coronary
intervention (PCI) was performed in 335 patients and
CABG in 17 patients. 41 patients were taking antiarrhythmic
drugs (20 pts amiodarone). B blockers were used in
51 patients. Mean LVEF was 51.
Prognostic variables
studies were: LVEF < 40% measured by left ventriculography;
NSVT on Holter (≥3 consecutive ventricular beats);
late potential on signal averaging ECG (LP by SAECG;
2of 3 criteria present: f-QRS, RMS40, LAS40);
TWA (µV), age > 70 years, gender, anterior
wall MI, PCI, CABG, antiarrhythmic drugs, and beta
blockers.
TWA was assessed
using a CH2000 system based on the power spectral
analysis during supine bicycle exercise. TWA was defined
as positive, negative, or
indeterminate (during heart rate of 105-10 bpm, sustained
alternans ≥1 min with alternans voltage ≥1.9
µV and alternans ratio ≥3.0). All patients
underwent noninvasive tests when hemodynamically stable.
The mean time of noninvasive sampling was 24 days
after acute MI. Noninvasive testing was done in 91%
of patients between 2 and 5 weeks after acute MI and
in 9 patients before 2 weeks post-MI or 2 months post-MI.
Clinical follow-up
was obtained at 2-week and 1-month intervals. During
follow-up, restudy of coronary
angiography (usually 3-6 months post-MI) was performed
in 335 patients who had undergone revascularization.
PCI or CABG was performed in patients with significant
coronary restenosis.
The
study endpoint was SCD, ventricular fibrillation (VF),
and SVT. Nine patients died of non-arrhythmic causes
such as pump failure and re-infarction during follow-up
and were excluded from data analysis. Therefore, 363
patients were assessed.
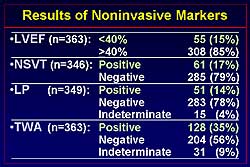
Figure
1 shows the incidence of the noninvasive markers in the study population.
LVEF < 40% was present in 15% of patients, NSVT
positive in 17%, LP 14%, and TWA 35% of patients.
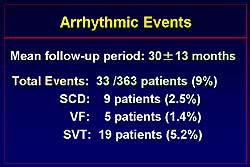
During the mean
follow-up of 30 months, 9% of patients (33/363 patients)
had an arrhythmic event (SCD 9 patients, VF 5 patients,
SVT 19 patients) (Figure
2).
|
|
 |
|
Figure
1. The incidence of the noninvasive markers in the
study population.
|
| Click
to enlarge |
|
|
 |
|
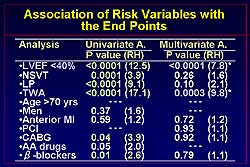
Figure
3. Univariate and multivariate analysis of risk factors
and endpoints.
|
| Click
to enlarge |
|
The
association between risk factors and endpoints is
shown in Figure
3. LVEF, NSVT, LP, TWA, bypass surgery, and use
of beta blockers were significantly related to the
occurrence of an endpoint on univariate analysis and
are independent markers of risk. Multivariate analysis
revealed reduction in LVEF and TWA as statistically
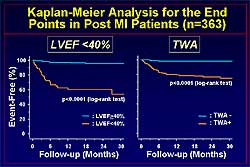
significant markers for an event. Event-free survival
was significantly reduced during follow-up in patients
with an LVEF < 40% compared to > 40%, and in
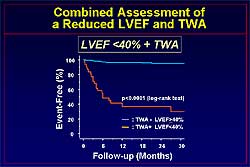
patients with TWA, as shown in Figure
4. In patients with an LVEF < 40% and
TWA, compared to the absence of both, event-free survival
is significantly worse (Figure
5).
Analysis for the
predictive value of LVEF and TWA shows that LVEF has
a high specificity (90%) and that TWA has a high sensitivity
(91%). The combination of LVEF and TWA has a
61% sensitivity and 96% specificity (Figure
6). The positive predictive value for LVEF
and TWA is 65%.
Ikeda and colleagues
conclude that their data suggest that both a reduced
LVEF and TWA are strong risk stratifiers for arrhythmic
events after acute MI. Further, TWA could enhance
the predictive value of a reduced LVEF, which was
introduced by the MADIT II trial as a useful indicator
for the prophylactic implantation of ICD in post-MI
patients, and hence could contribute to its cost-effective
use.
|
|
 |
|
Figure
5. The relation between the combined assessment of left ventricular ejection fraction and T wave
alternans and event-free survival.
|
| Click
to enlarge |
|
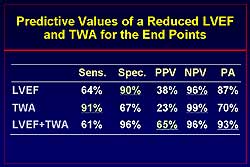 |
| Figure
6. The predictive value of left ventricular ejection
fraction and T wave alternans for endpoints.
|
| Click
to enlarge |
|
PAGE
TOP
|
Substrate Mapping and Ablation of Ventricular Tachycardia Late after Myocardial Infarction by Electroanatomical Mapping
Shigeru Ikeguchi
Takeda General Hospital, Kyoto, Japan
|
|
Treatment for life-threatening ventricular
arrhythmias after myocardial infarction (MI) includes
ICD implantation as a first-choice treatment and medical
therapy with beta blockers (BB) and amiodarone. However,
ablation may be needed to treat frequent arrhythmias.
The recurrence rate
of ventricular tachycardia (VT) and ventricular fibrillation
(VF) after ICD implantation was 60% rehospitalization
at 1 year in the AVID study. At 2 years, the addition
of drug therapy, particularly amiodarone, to ICD therapy
was needed in 38% of patients with an ejection fraction
(EF) < 0.20, 18% of patients with an EF > 0.34,
and 30% of patients with an EF of 0.20-0.34. In patients
with stable monomorphic VT, mapping for ablation is
done during VT pacing. If the post pacing interval (PPI) equals the VT cycle length, the ablation site lies within the reentry
circuit.
Soejima and colleagues
showed that the incidence of unstable VT in 40 patients
referred for catheter ablation after MI was 33%, stable
VT was 18%, and both unstable and stable VT was 49%.
So, 82% of patients had some degree of unstable VT.
The LVEF was 0.29 and the mean number of VT was 3.5
per patient. Unstable VT is characterized as being
hemodynamically unstable, where the blood pressure
drops suddenly; unstable reentrant circuit, meaning
spontaneous change in VT morphology; and non-induciblity
during electrophysiologic study.
Non-contact endocardial
mapping (ESI) is one mapping approach. Schilling and
colleagues reported 24 patients with VT after MI in
whom 81 of 97 VTs were mapped with ESI. In 99% of
the patients, exits were identified, but presystolic
activity was identified in 67%. Ablation was performed
for 47% of the VTs, with a success rate about 64%.
Concepts of substrate mapping
The size of the
abnormal myocardium is estimated using voltage mapping,
with entrainment mapping
and pace mapping used to further identify the focus
in detail. Isolated delayed potential during sinus
rhythm is monitored and then the site is ablated.
However, isolated delayed potential is usually within
the abnormal myocardium, so voltage mapping may be
applied to both methods.
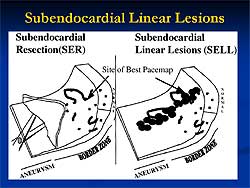
Linear ablation
lesions are used for control of unmappable VT using
the electroanatomical mapping system. In abnormal
myocardium, the substrate map is done using pace mapping
and linear ablation lesions created.
|
 |
|
Figure
1. Classification for substrate mapping developed by
Marchlinski.
|
| Click
to enlarge |
 |
|
Figure
3. Illustration of the principles for linear lesions
developed by Soejima.
|
| Click
to enlarge |
|
Marchlinski and
colleagues used a bipolar 4 mm tip electrode to differentiate
ischemic and nonischemic myocardium for VT ablation.
95% of the normal electrograms had an amplitude >
1.55 mV. However, in the Carto system, the measurement
is independent of the QRS timing. This means that
the measurement of maximum amplitude of Egm is performed. The classification developed by Marchlinski
and colleagues is shown in Figure
1.
Principles for guiding
linear lesions can be taken from the work of Marchlinski
and colleagues. First, they identified abnormal myocardium
and then created linear lesions across the border
of the endocardium with abnormal electrogram amplitude.
For dense scar and normal myocardium, the lesion was
extended from the lowest amplitude signal area (<0.5
mV) to a distinctly normal signal area (>1.5-2.0
mV) or valve continuity. Also, ablation lines were
created crossing border zones at sites where pace
mapping approximated the QRS morphology of VT.
Limitations of pace
mapping include the fact that during sinus rhythm
pace mapping does not always correspond to VT QRS,
particularly when proximal to the central channel is paced, at which time
the potential might be captured in the opposite direction
of the outer loop (Figure
2).
Stevenson and Soejima
at Brigham and Women's Hospital studied catheter ablation
of multiple and unstable VT after MI. For stable VT,
entrainment mapping during VT was performed to identify
concealed fusion and postpacing interval identical to VT cycle length (reentrant circuit
isthmus). For unstable VT,
voltage substrate mapping was performed and then pace
mapping to identify the lesions and conductive delay.
Soejima developed
several principles for guiding linear lines. Select
the initial ablation site at the reentrant circuit
isthmus or by the pace mapping finding (Figure
3). The linear lesions should be parallel with
the border zone with a margin of 1-2 cm. If the mitral
valve is within 2-3 cm of the expected lesion, a submitral
isthmus ablation line was selected. The identification
of the reentry isthmus was associated with better
VT control in this study.
|
|
Another approach
has been described by researchers at Oklahoma University. Usually local
ventricular potential in sinus rhythm is
recorded corresponding to QRS complex.. But sometimes in MI cases, the potential is delayed, and this may
be related to
reentry circuit. Their ablation strategy is based on this concept.
The sites with delayed potential in sinus rhythm
are selected and pace mapping
in sinus rhythm or entrainment mapping during VT is
not required in their approach. In 16 patients with
prior MI and frequent unmappable VT, there were 2-8
(median 4) localized areas or lines of isolated late
potential (ILP) per patient. For the ILP areas, ablation
was performed 1-12 times (median 5). Per patient,
8-50 ablations (median 25 )
were performed. In 8 patients, irrigation tip was
used. The follow-up was 3-62 months, with a median
of 11.5 months, and 12 of 16 patients were free of
VT, 3 of 4 patients with recurrence were well controlled
with antiarrhythmic therapy.
In summary, substrate
mapping and ablation are effective to reduce the frequency
of unstable VT episodes. The challenge for future
research is to determine the most effective approach.
What is the best method to guide mapping? Pace
mapping during sinus rhythm, entrainment mapping during
VT and pace mapping in sinus rhythm, or isolated
late potential mapping? Limitations of substrate
mapping and ablation of the endocardium include 1)
the potential reentry circuit being too deep in the
endocardium and thus unmappable or ablatable. 2) For
such cases, saline cooled or irrigation tip ablation
system can be used. The epicardial approach may be
required for epicardial substrate mapping, in which
the epicardium is punctured, and ablation in selected
patients.
|
PAGE
TOP
|
Molecular and Genetic Basis for the Treatment of Long QT-Related Lethal Ventricular Arrhythmias
Minoru Horie
Kyoto University Graduate School of Medicine, Kyoto, Japan
|
|
Genetic screening techniques are
useful, but time-consuming and costly. EKGs must be
used to diagnose these patients, rather than depending
on the more expensive genetic diagnostic method. The
triggers of the 3 major genotypes of LQTS have been
identified: LQT1, exercise and emotional stress; LQT2,
auditory stimuli, sleep, bradycardia, and hypokalemia;
LQT3, infrequent in Japan, bradycardia
and sleep. Patients with LQT2 and LQT3 have a high
recurrence rate with beta blocker therapy, and annual
mortality for LQT3 is reported to be 58% with beta
blocker therapy. Thus, it is critical to identify
the genotype of LQTS on clinical findings.
LQTS is caused by
distinct mutations in different genes, so the phenotype
differs depending on the genotype. In the experimental
model, it has been shown that the interval between
the peak and the end of the T wave (Tpe) on transmural
ECG reflects transmural dispersion of repolarization
(TDR), which is amplified by ޏ-adrenergic stimulation
in the LQT1 model. Cardiac events are more frequently
associated with enhanced adrenergic factors in LQT1.
Horie and colleagues
sought to identify the genotype-specific changes in
body surface 12-lead ECGs, to determine whether Tpe
in 12-leads ECG reflect TDR and whether exercise stress
testing can help to differentially diagnose LQT1 and
LQT2.
|
 |
|
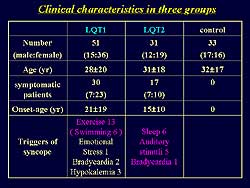
Figure
1. The clinical characteristics of the study population. |
| Click
to enlarge |
|
They studied 51
patients with LQT1 and 31 patients with LQT2 and 35
patients in the control group. The parameters of repolarization
studied were T wave morphology, QT, QTc, Tpe, and
Tpec. The clinical characteristics of the study population
are shown in Figure
1. In LQT1, syncope was induced by exercise, and
30 of the patients were symptomatic. In LQT2, 17 of
the patients were symptomatic and syncope was induced
by sleep, auditory stimulation, and bradycardia. Baseline
ECG data showed that QTc and Tpec were longer in the
LQT1 and LQT2 groups compared to control (510 ms,
520 ms, 402 ms, respectively; and 142 ms, 195 ms,
99ms, respectively).
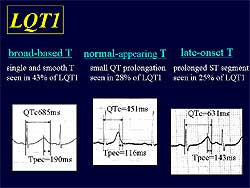
The three patterns
of T wave in LQT1 are shown in Figure
2. The broad-based T pattern defined as a single
and smooth T was seen in 43% of patients, the normal
appearing T pattern of a small QT prolongation was
seen in 28% of patients, and the late-onset T pattern
with a prolonged ST segment was seen in 25% of patients.
The T wave patterns in LQT2 are shown in Figure
3. The broad-based T pattern was seen in 34%
of patients, the Bifid T with a small notch in 33%,
and the Bifid T with a large notch in 255 of patients.
On exercise, in
LQT1 the QTc is lengthened to 590 ms from 452 ms at
baseline, and the Tpec is lengthened to 258 ms from
108 ms at baseline. The end of the Q wave is not clearly
distinguishable because of this lengthening. In LTQ2,
the bifud pattern is clearly seen on exercise. Figure
4 illustrates the change of T wave pattern during
exercise in the LQT1 and LQT2 groups.
The ECG data before
and during exercise is shown in Figure
5. In LQT1, the QTC is longer on exercise
compared to baseline (599 ms vs 511 ms, respectively),
whereas there is no change in LQT2. Tpec is longer
in LQT1 on exercise compared to baseline 9215 ms vs
142 ms), whereas it is decreased on exercise in LQT2
(163 ms vs 197 ms).
|
|
| |
|
Figure 4. The change of T wave pattern during exercise in
the LQT1 and LQT2 groups. |
| Click
to enlarge |
|
|
|
In summary, at baseline,
LQT1 and LQT2 have three types of T wave patterns.
Broad-based T pattern is seen in 40-50% of LQT1 and
30% of LQT2 patients, so differentiation is not possible.
However, exercise stress does differentiate the two
genotypes. LQT1 has morphologic changes of the T wave
into a broad-based T and there is significant QTx
prolongation mainly due to Tpec prolongation with
negative Tpe/RR slope. In LQT2, exercise produced
a prominent notch on T wave with no significant change
in QTc and Tpec.
Horie and colleagues
conclude that exercise testing is useful to facilitate
genotyping of most common variants of the LQTS. Exercise
induces genotype-specific changes in the T wave pattern.
Exaggerated prolongation of the QT interval in LQT1
was primarily due to an increase in Tpe, presumably
reflecting TDR.
|
PAGE
TOP
|
Report
Index | Previous Report
| Next Report
Scientific
Sessions | Activities
| Publications
Index
Copyright © 2003
Japanese Circulation Society
All Rights Reserved.
webmaster@j-circ.or.jp
|
|